Radiant Intensity#
optiland.analysis.RadiantIntensity groups traced rays by their outgoing direction, rather than by where they hit the image plane. This example uses the on-axis field of the Cooke triplet at its primary wavelength (0.55 µm).
We use relative mode: the stored map contains summed ray weights per angular bin, and the plots are normalized to their peak. These weights are not calibrated power, so this example does not report W/sr. Absolute radiant intensity requires ray powers in watts and use_absolute_units=True, which also divides each bin’s power by its solid angle.
[1]:
from io import BytesIO

import matplotlib.pyplot as plt
from IPython.display import Image, display

from optiland.analysis import RadiantIntensity
from optiland.samples.objectives import CookeTriplet


def show_figure(fig):
    """Embed a figure even when running with MPLBACKEND=Agg."""
    buffer = BytesIO()
    fig.savefig(buffer, format="png", dpi=120, bbox_inches="tight")
    display(Image(data=buffer.getvalue()))
    plt.close(fig)


lens = CookeTriplet()
Choose the angular window and sampling#
reference_surface_index=-1 uses directions at the image surface. X and Y angles are the projections atan2(L, N) and atan2(M, N), in degrees, where L, M and N are direction cosines.
They are not positions in millimeters or the polar and azimuthal angles of spherical coordinates. X angle is the angle between the ray’s projection and the Z axis in the XZ plane, and Y angle is the angle between the ray’s projection and the Z axis in the YZ plane.
The window below covers −8° to +8° in both directions. Rays outside that window are not binned. More bins reveal finer structure but require more rays to avoid sparse bins. For distribution="hexapolar", num_rays=80 means 80 pupil rings, not 80 individual rays: the deterministic pattern contains 19,441 launch points.
[2]:
intensity = RadiantIntensity(
    lens,
    fields=[(0.0, 0.0)],
    wavelengths="primary",
    distribution="hexapolar",
    num_rays=80,
    reference_surface_index=-1,
    num_angular_bins_X=41,
    num_angular_bins_Y=31,
    angle_X_min=-8.0,
    angle_X_max=8.0,
    angle_Y_min=-8.0,
    angle_Y_max=8.0,
    use_absolute_units=False,
)
Read the map and central profile#
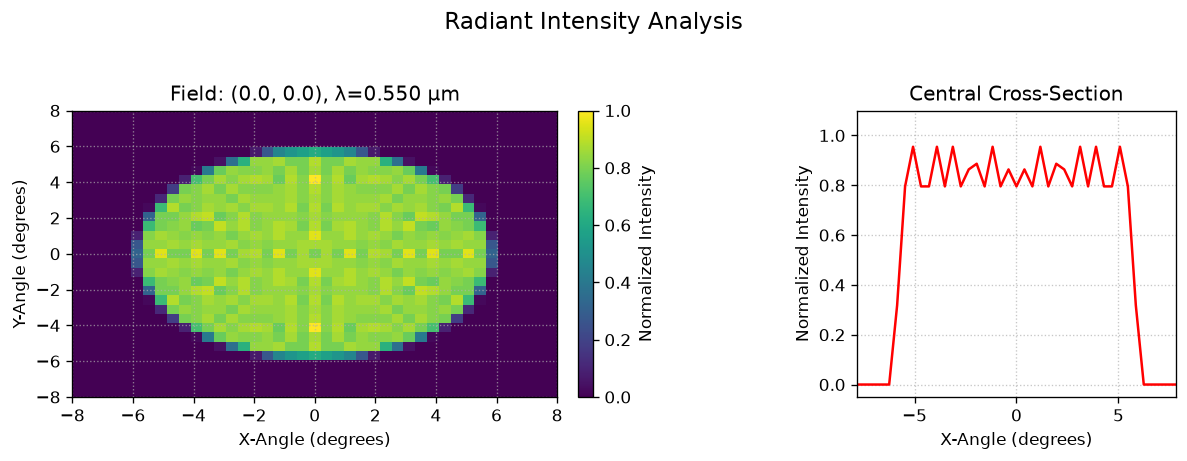
The color represents the summed weight in each angular bin divided by the largest bin weight in this field/wavelength map. The peak is 1; a value of 0.5 means half the peak bin weight, not half the total power. Empty bins have value zero. The right-hand curve is the X-angle profile through the central Y-angle bin.
In relative mode, normalize=True changes only the display: intensity.data still holds unnormalized bin weights. Sampling and bin size affect the pattern; it is not an image-plane irradiance map or a calibrated per-steradian distribution.
[3]:
fig, axes = intensity.view(normalize=True, cmap="viridis", figsize=(10, 4), show=False)
fig.subplots_adjust(wspace=0.6)
show_figure(fig)
Select a different cross-section#
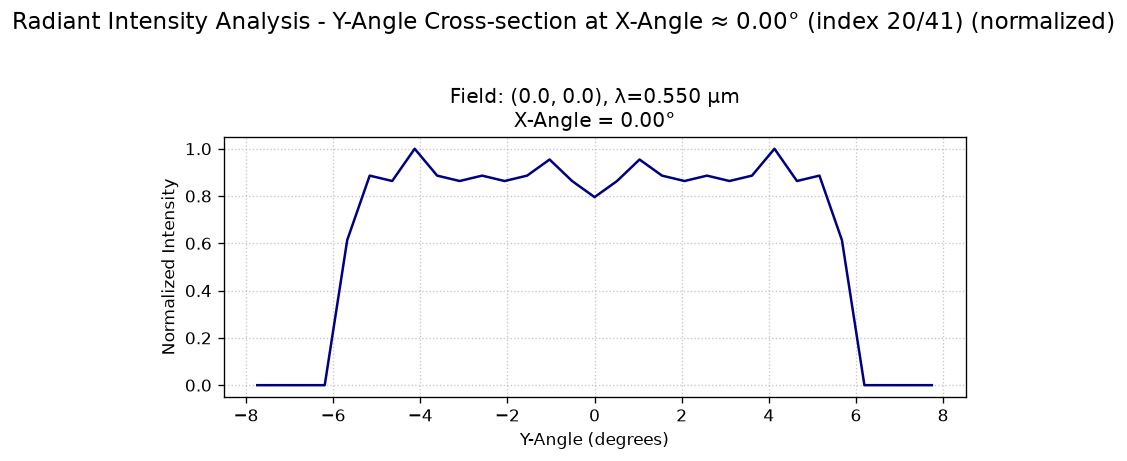
cross_section=("cross-y", -1) plots Y angle at the central X-angle bin; −1 selects the central bin. Use ("cross-x", index) to select a fixed Y-angle bin instead. Normalization still uses the peak of the whole map, so an arbitrary slice need not reach 1.
[4]:
fig, axes = intensity.view(
    cross_section=("cross-y", -1),
    normalize=True,
    cross_section_color="navy",
    figsize=(7, 4),
    show=False,
)
show_figure(fig)