
Chromatic Focal Shift#
The chromatic focal shift is the position of the paraxial focus as a function of wavelength, measured from the focus at the primary wavelength. For each wavelength, a paraxial marginal ray is traced through the system, and its focus is found where it crosses the axis in image space.
[1]:
from optiland.analysis import ChromaticFocalShift
from optiland.samples.simple import CementedAchromat
[2]:
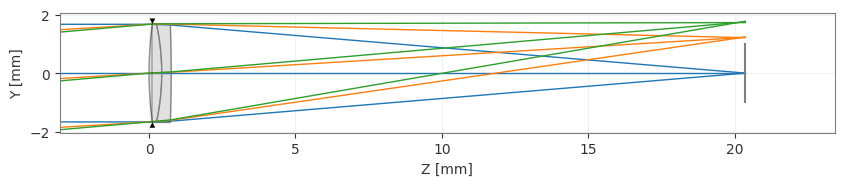
lens = CementedAchromat()
[3]:
lens.draw()
[3]:
(<Figure size 1000x400 with 1 Axes>, <Axes: xlabel='Z [mm]', ylabel='Y [mm]'>)
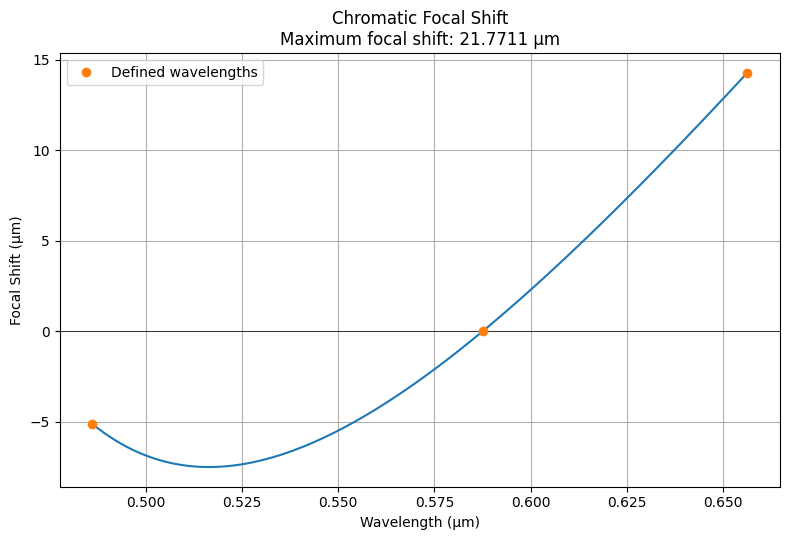
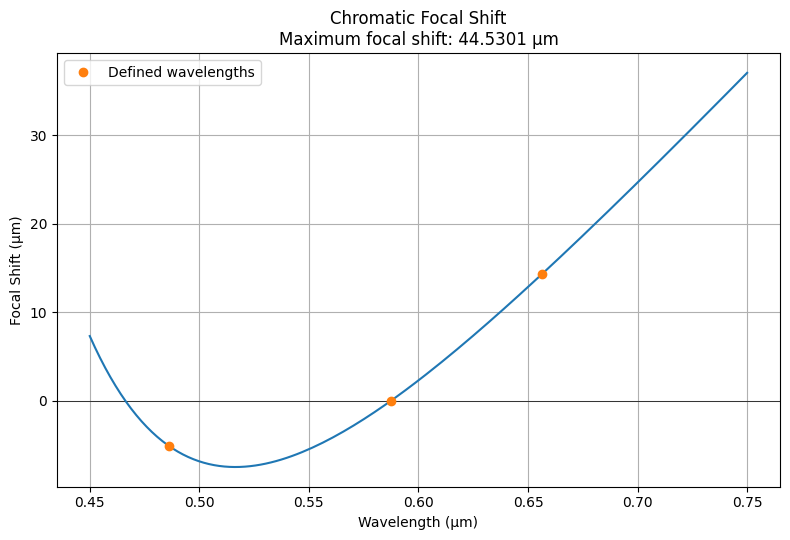
By default the curve spans the optic’s defined wavelengths, here the F, d and C lines. Pass wavelength_range (in µm) to plot a different range.
[4]:
cfs = ChromaticFocalShift(lens)
cfs.view()
[4]:
(<Figure size 800x550 with 1 Axes>,
 <Axes: title={'center': 'Chromatic Focal Shift\nMaximum focal shift: 21.7711 µm'}, xlabel='Wavelength (µm)', ylabel='Focal Shift (µm)'>)
How to read the plot:
A positive shift means the focus at that wavelength lies farther along the optical axis than the focus at the primary wavelength.
The markers are the optic’s defined wavelengths; the curve is zero at the primary wavelength.
The vertical distance between two points of the curve is the axial separation of their foci. Wavelengths at the same height on the curve focus at the same place.
The maximum focal shift, shown in the title, is the full range of the curve: the spread of the foci over the plotted wavelengths.
This achromat has a minimum near 0.52 µm: wavelengths on either side of it, at equal heights, are brought to a common focus. The F and C foci are not equal in this design; the C focus is about 19 µm beyond the F focus.
[5]:
print(f"Maximum focal shift: {cfs.max_focal_shift() * 1e3:.2f} µm")
Maximum focal shift: 21.77 µm
[6]:
cfs = ChromaticFocalShift(lens, wavelength_range=(0.45, 0.75))
cfs.view()
[6]:
(<Figure size 800x550 with 1 Axes>,
 <Axes: title={'center': 'Chromatic Focal Shift\nMaximum focal shift: 44.5301 µm'}, xlabel='Wavelength (µm)', ylabel='Focal Shift (µm)'>)