Thin Films
Multilayer Stack
Design and analyze complex dielectric thin-film stacks.
IntermediateCoatings & PolarizationNumPy backend10 min read
Base example with (TiO /SiO )*10 on BK7
Core concepts used
ThinFilmStack(incident_material=air, substrate_material=BK7)
The primary container for multilayer coatings. It manages the sequence of layers and the surrounding media.
add_layer_qwot(material, qwot_thickness=1.0)
Adds a layer where thickness is defined in 'Quarter-Wave Optical Thickness' units, relative to a center wavelength.
SpectralAnalyzer(stack=stack)
A specialized utility for generating R/T/A plots versus wavelength, AOI, or wavenumber.
analyzer.map_view(...)
Generates 2D heatmaps showing reflectance as a combined function of both angle and wavelength.
Step-by-step build
1
Import thin-film and materials modules
python
import optiland.backend as be
from optiland.thin_film import ThinFilmStack, SpectralAnalyzer
from optiland.materials import Material, IdealMaterial
2
Define the layer materials and substrate
python
SiO2 = Material("SiO2", reference="Gao")
TiO2 = Material("TiO2", reference="Zhukovsky")
BK7 = Material("N-BK7", reference="SCHOTT")
air = IdealMaterial(n=1.0)
3
Build the quarter-wave (TiO2/SiO2)x10 stack and plot its structure
python
stack = ThinFilmStack(
    incident_material=air, substrate_material=BK7, reference_wl_um=0.6
)
for _ in range(10):
 stack.add_layer_qwot(material=TiO2,qwot_thickness=1.0, name="TiO$_2$")
 stack.add_layer_qwot(material=SiO2, qwot_thickness=1.0, name="SiO$_2$")

fig, ax = stack.plot_structure()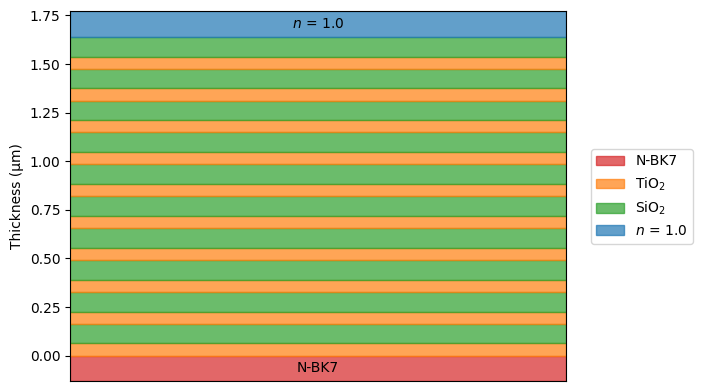
4
Plot reflectance vs. wavelength for s and p polarizations
This is a plot helper to plot R/T/A versus wavelength and/or AOI.
wavelength_view() (nm, μm, eV, cm⁻¹, Hz are available), angular_view(), map_view()
python
analyzer = SpectralAnalyzer(stack=stack)
wl = be.linspace(350, 1200, 1000) # Wavelength range in nm
fig, ax = analyzer.wavelength_view(wl,
                                wavelength_unit='nm',
                                aoi=45, to_plot=["R"],
                                polarization=["s", "p"])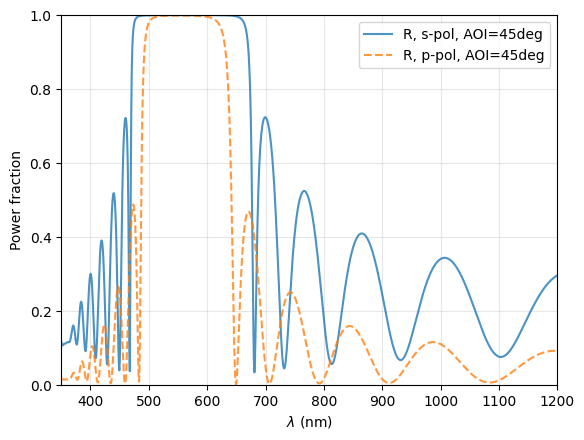
5
Generate a wavenumber-vs-angle reflectance heat map
python
wl = be.linspace(8000, 25000, 1000) # approximatly 0.4 to 1.25 um in wavenumber
angles = be.linspace(0, 80, 300)
fig, ax = analyzer.map_view(wavelength_values=wl,
                         wavelength_unit='wavenumber',
                         aoi_values=angles, aoi_unit="deg",
                         to_plot=["R"],
                         polarization=["s", "p"],
                         colormap="magma")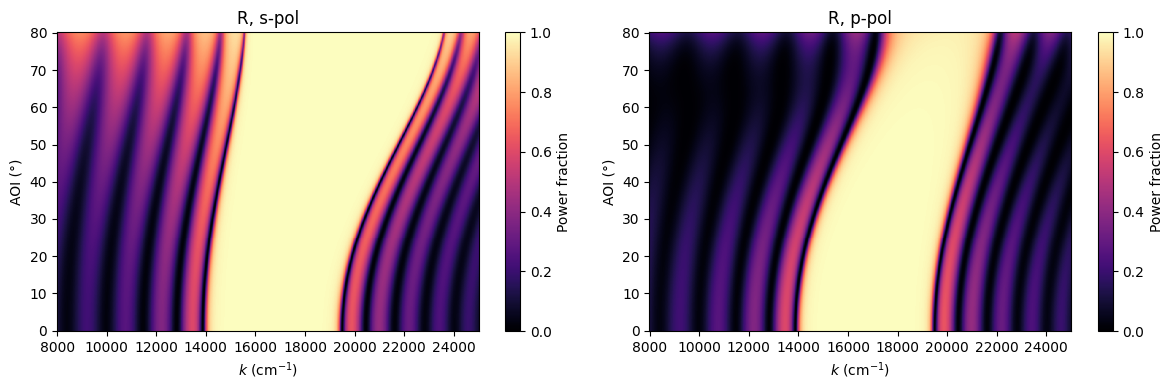
Show full code listing
python
import optiland.backend as be
from optiland.thin_film import ThinFilmStack, SpectralAnalyzer
from optiland.materials import Material, IdealMaterial

SiO2 = Material("SiO2", reference="Gao")
TiO2 = Material("TiO2", reference="Zhukovsky")
BK7 = Material("N-BK7", reference="SCHOTT")
air = IdealMaterial(n=1.0)

stack = ThinFilmStack(
  incident_material=air, substrate_material=BK7, reference_wl_um=0.6
)
for _ in range(10):
  stack.add_layer_qwot(material=TiO2,qwot_thickness=1.0, name="TiO$_2$")
  stack.add_layer_qwot(material=SiO2, qwot_thickness=1.0, name="SiO$_2$")

fig, ax = stack.plot_structure()

analyzer = SpectralAnalyzer(stack=stack)
wl = be.linspace(350, 1200, 1000) # Wavelength range in nm
fig, ax = analyzer.wavelength_view(wl,
                                 wavelength_unit='nm',
                                 aoi=45, to_plot=["R"],
                                 polarization=["s", "p"])

wl = be.linspace(8000, 25000, 1000) # approximatly 0.4 to 1.25 um in wavenumber
angles = be.linspace(0, 80, 300)
fig, ax = analyzer.map_view(wavelength_values=wl,
                          wavelength_unit='wavenumber',
                          aoi_values=angles, aoi_unit="deg",
                          to_plot=["R"],
                          polarization=["s", "p"],
                          colormap="magma")
Conclusions
- A periodic (TiO₂/SiO₂)×10 quarter-wave stack on a BK7 substrate is assembled in just a few lines using
ThinFilmStackandadd_layer_qwot, with the physical layer sequence directly visible in the structure plot. - The
SpectralAnalyzerclass provides a unified interface for reflectance, transmittance, and absorptance plots across multiple spectral units — nanometres, wavenumbers, eV, and more — without changing the underlying stack object. - Separate s- and p-polarisation curves from
wavelength_view()reveal the polarisation splitting introduced by oblique incidence, which is critical for beamsplitter and bandpass filter design. - The
map_view()heat map simultaneously visualises how reflectance evolves across both angle of incidence (0–80°) and a wide wavenumber range, exposing angle-sensitive stopband shifts at a glance. - Using the
magmacolormap in the heat map highlights high-reflectance regions clearly, demonstrating how Optiland's plotting utilities can be customised for publication-quality output.
Next tutorials
NextThin-Film OptimizationAutomate layer thickness design to meet spectral performance targets.RelatedIntroduction to PolarizationLearn how polarization states interact with these complex surfaces.
Original notebook: Tutorial_6c_Multilayer_Stack.ipynb on GitHub · ReadTheDocs